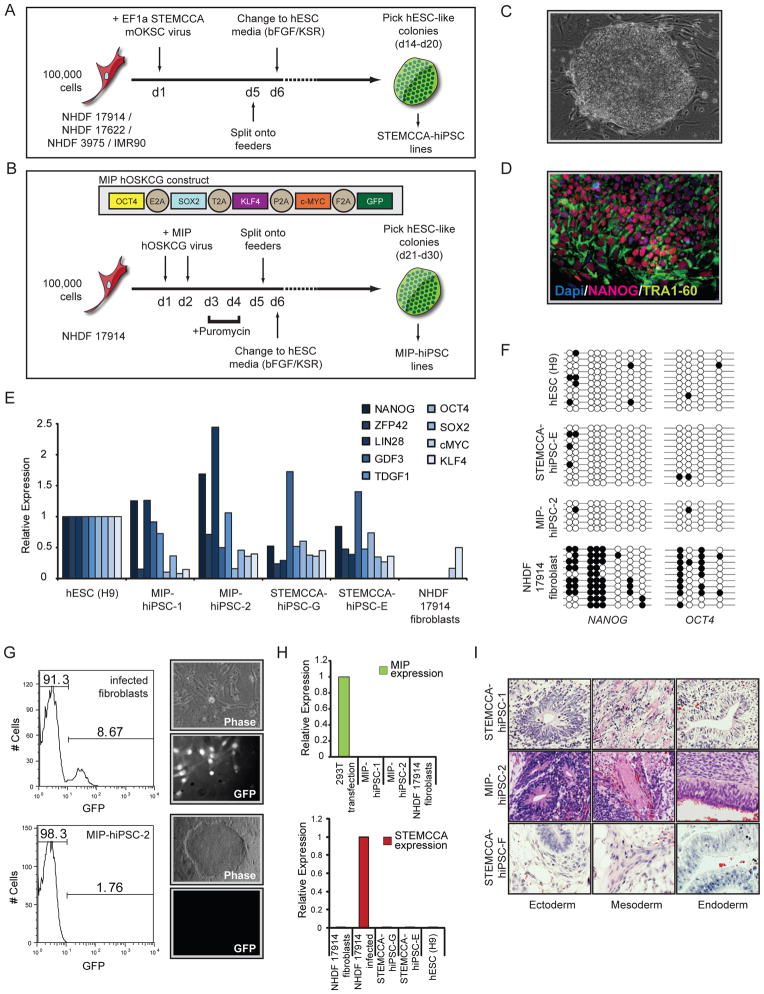
Figure 1. Establishment of female hIPSCs using lenti- and retroviral polycistronic reprogramming cassettes.
(A) Schematic representation of reprogramming experiments performed with the STEMCCA lentiviral vector. This vector encodes the mouse reprogramming factors in the order of Oct4 (O), Klf4 (K), Sox2 (S), and cMyc (C). The four starting female human fibroblast lines are listed.
(B) As in (A) for the MIP- retroviral reprogramming approach with fibroblast line NHDF17914. The MIP-vector encodes the human reprogramming factors in the indicated order.
(C) Phase-contrast image of a representative STEMCCA-hiPSC colony.
(D) TRA1-60 (green) and NANOG (red) immunostaining of STEMCCA-hiPSC line E. Nuclei were detected with Dapi (blue).
(E) Graph summarizing real-time PCR data for transcript levels of endogenously expressed pluripotency genes in indicated cell lines. All values are relative to GAPDH expression.
(F) Bisulfite sequencing of promoter regions of NANOG and OCT4 in indicated cell lines.
(G) Analysis of MiP-based GFP expression at different steps of the reprogramming process. FACS analysis of GFP levels in MIP-retrovirally infected fibroblasts before puromycin selection demonstrating approximately 9% infection efficiency. Phase-contrast and GFP fluorescence images to the right indicate that almost all cells express GFP at day 5 of reprogramming upon puromycin selection. Resulting hiPSCs do not express GFP as shown in the GFP fluorescence image and the FACS analysis of MIP-hiPSC line 2 in the bottom row.
(H) Real-time PCR for ectopic expression from the MIP- (top) or STEMCCA- (bottom) reprogramming cassettes in indicated cell lines, relative to GAPDH expression.
(I) Teratoma formation with differentiation into all three germ layers in three representative hiPSC lines. See Fig S1 for additional data.

