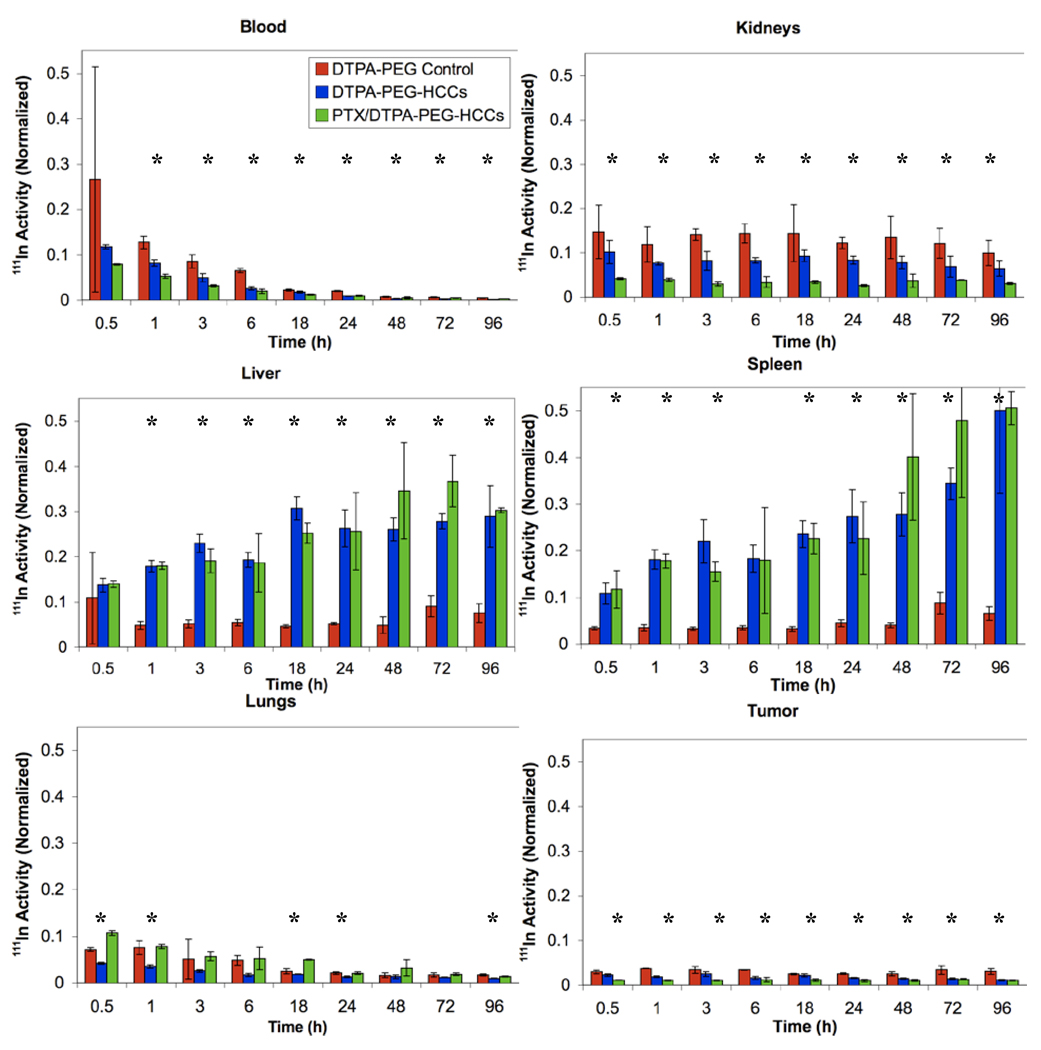
Figure 10.
Distribution of [111In]DTPA-PEG-Ac, [111In]DTPA-PEG-HCCs and PTX/[111In]DTPA-PEG-HCCs in the blood, kidneys, liver, spleen, lungs and tumor of tongue tumor burdened nude mice. The Y-axis in all figures was normalized to the total organ radioactivity count divided by the organ’s weight. This value is then divided by the initial radioactivity count injected in each mouse. All plots have the same Y-axis scale to ease comparisons. *ANOVA is statistically significant (p < 0.05).

