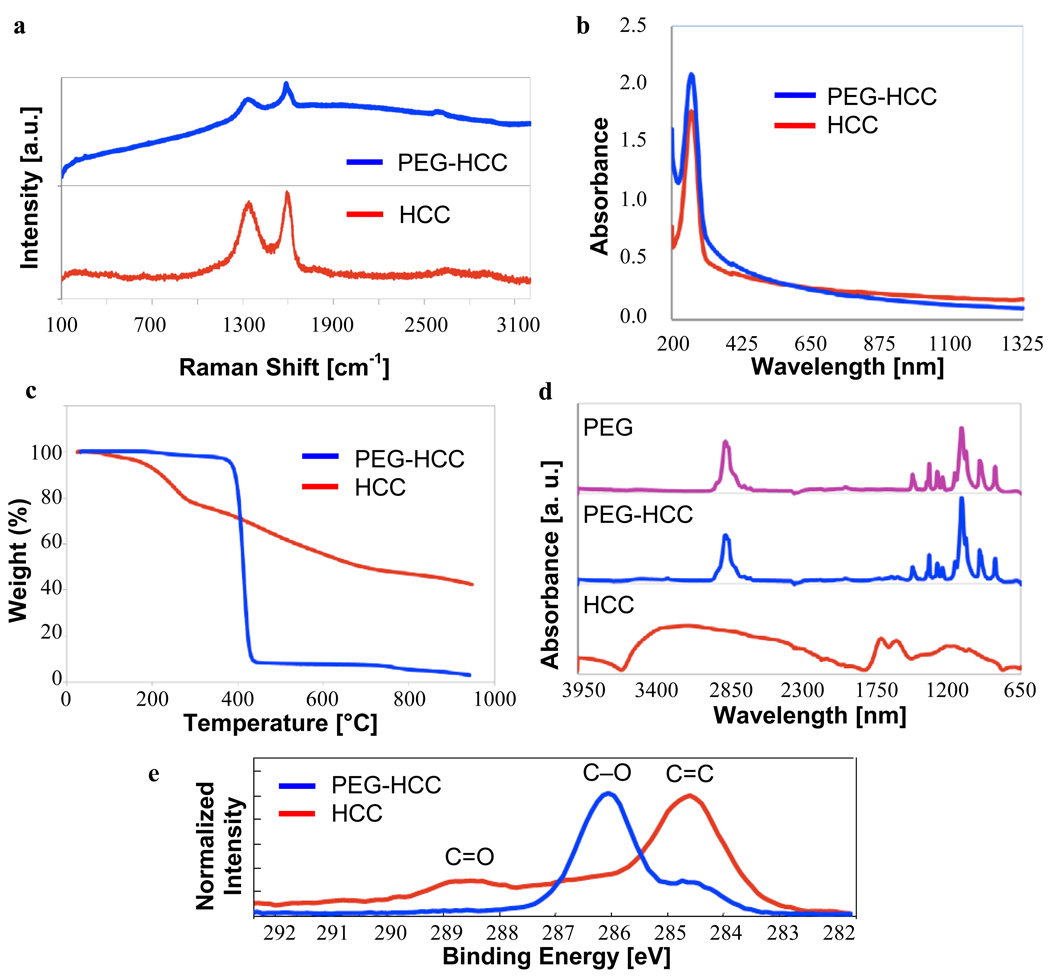
Figure 3.
Characterization of HCCs and PEG-HCCs. (a) Raman spectra are free of radial-breathing modes and have similar peak ratios. Fluorescence of the PEG-HCCs causes the baseline rise for that spectrum. (b) The UV-Vis spectra show similar traces for both compounds, indicative that their carbon cores are identical. (c) TGA indicates a 58% weight loss for the HCCs and a 97% weight loss for the PEG-HCCs (25–950 °C at 10 °C/min under Ar). (d) FTIR of HCCs, PEG-HCCs and PEG alone shows the PEG’s presence in the PEG-HCCs. The HCC absorbances are present but far less intense. (e) The C(1s) portion of the XPS spectrum reflects both the high degree of oxidation for the HCCs (peaks >286 eV for C=O bonds) and the presence of the PEG polymer for the PEG-HCCs (strong peak at 286 eV for C-O bond).

