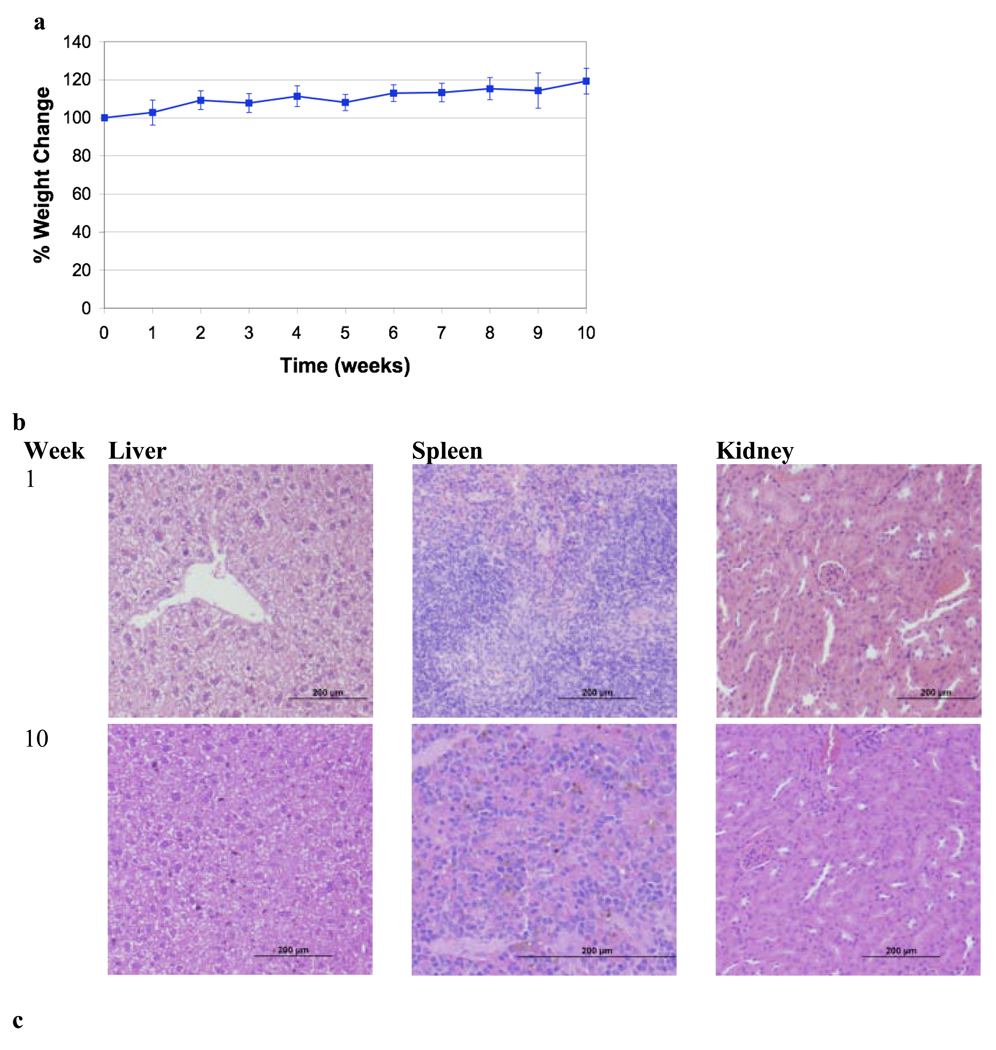
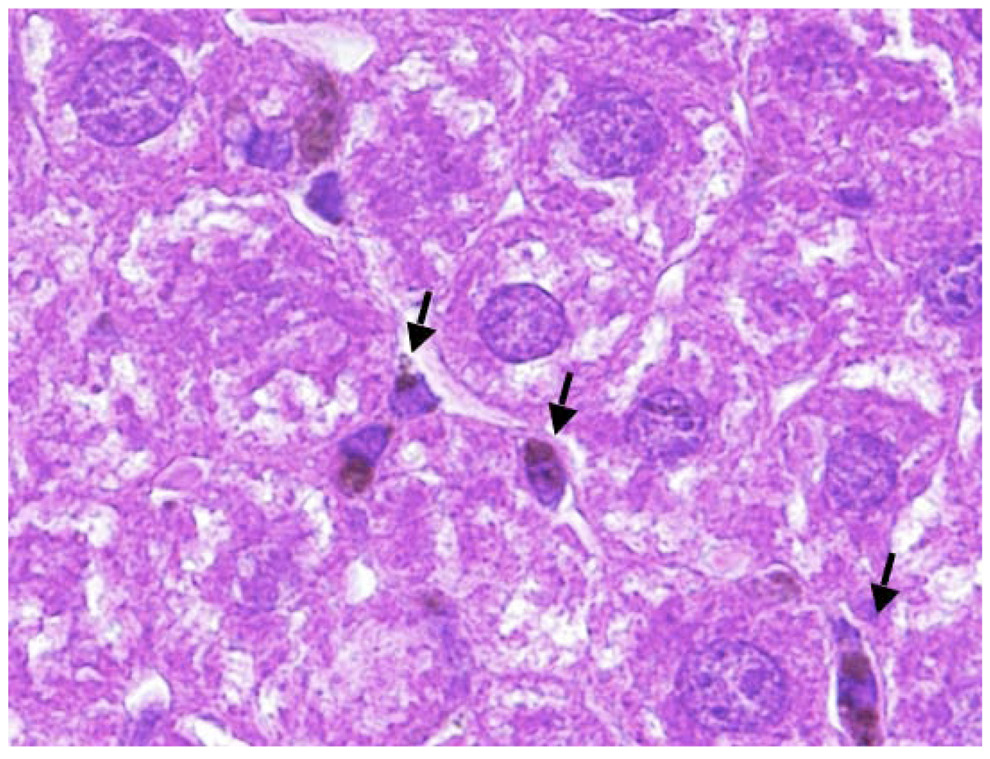
Figure 4.
Toxicity study of PEG-HCCs given weekly for 10 weeks. (a) Average percent weight change of mice over the 10 week period. The mice gradually gained weight as is normal for healthy mice. (b) Samples of liver, spleen and kidneys for mice treated for 1 week or 10 weeks. A few darker spots are evident in the liver sample of the mice treated for 10 weeks, but otherwise the tissues appear normal. Scale bars are 200 µm. (c) A higher magnification (100×) image of the liver from a mouse treated for 10 weeks. The edge length of the image is 200 µm. The arrows mark the darker spots that likely indicate the presence of PEG-HCC aggregates.


