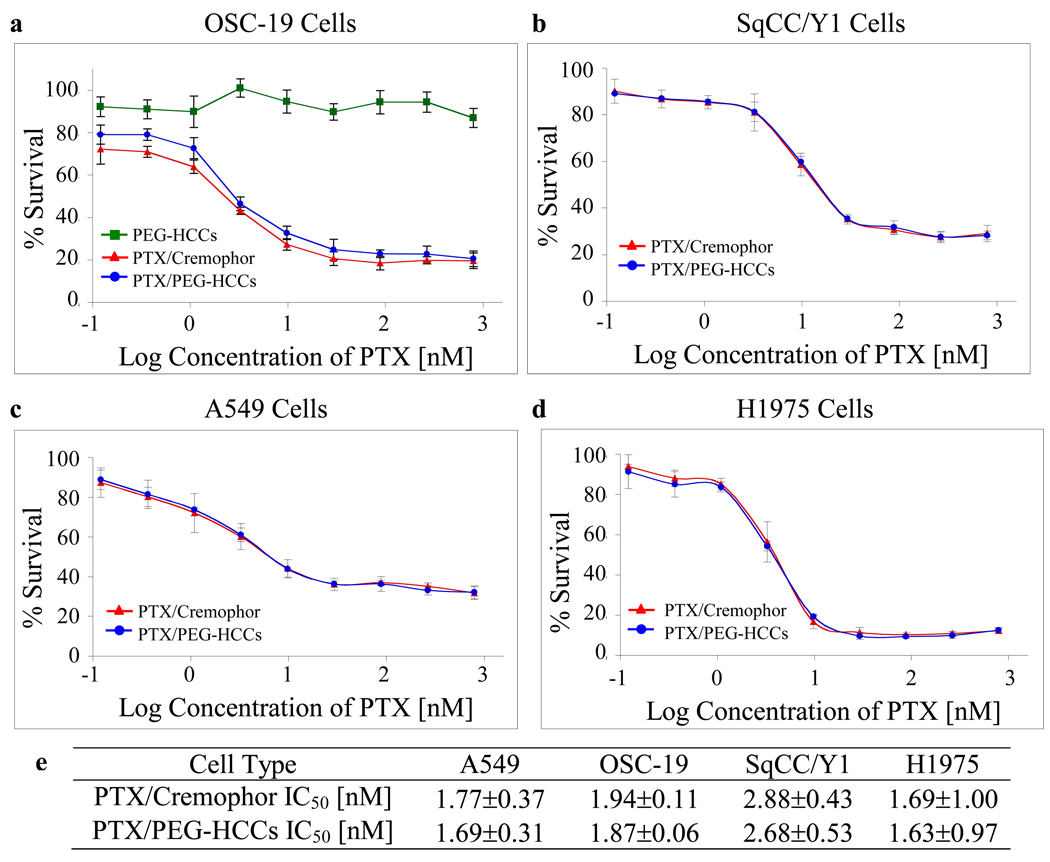
Figure 6.
In vitro efficacy of PTX/PEG-HCCs. Treatment of two head and neck cancer cell lines (a,b) and two breast cancer cell lines (c,d) with PTX/PEG-HCCs (blue line with circles) and PTX/Cremophor (red line with triangles). Plot (a) also shows the inability of PEG-HCCs alone to kill cells (green line with squares). Each graph represents an individual trial. Error bars are standard errors. Table (e) presents the IC50 data for an average of three trials and the standard deviations.

