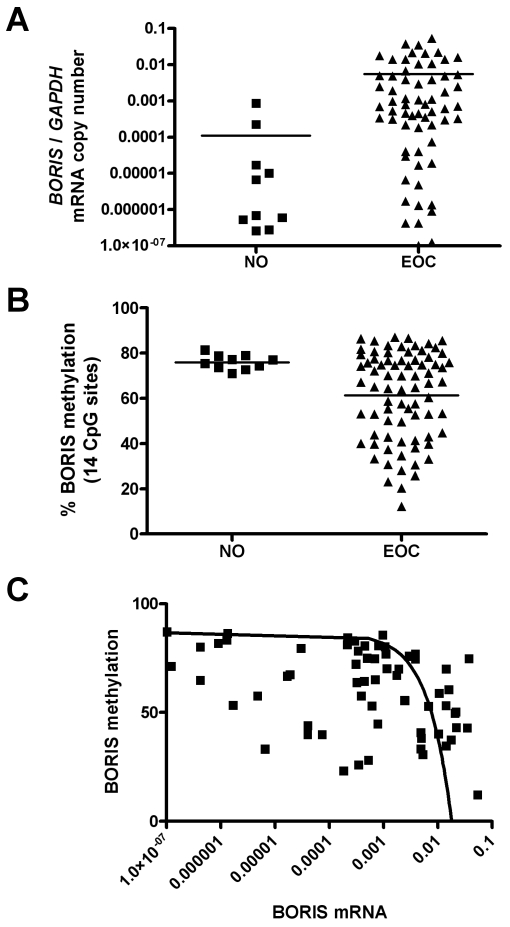
Figure 6.
BORIS mRNA expression and promoter methylation in normal ovary and ovarian cancer. (A) BORIS mRNA expression in normal ovary (NO) and epithelial ovarian cancer (EOC) tissues. BORIS expression was measured by qRT-PCR and was normalized to GAPDH. The difference between the two groups was not statistically significant (unpaired, two-tailed t-test; P = 0.1056), although a trend towards increased expression in EOC is apparent. (B) BORIS promoter DNA methylation in NO and EOC tissues. Methylation was measured by quantitative pyrosequencing. The difference between the two groups was statistically significant (unpaired, two-tailed t-test; P = 0.02). (C) Correlation between BORIS mRNA expression and promoter methylation in EOC. There is a highly significant inverse correlation between the two parameters (Kendall's Tau = -0.235, P = 0.007).

