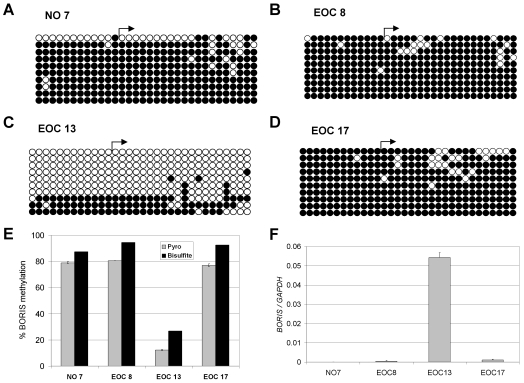
Figure 7.
BORIS methylation and expression in normal ovary (NO) and ovarian tumors (EOC). (A-D) The methylation status of the region diagrammed in Figure 2B was determined by sodium bisulfite DNA sequencing for samples (A) NO #7, (B) EOC #8, (C) EOC #13 and (D) EOC #17. Right arrows indicate the NCBI transcriptional start site. Rows show individually sequenced alleles and filled and open circles represent methylated and unmethylated CpG sites, respectively. (E) Comparison of BORIS promoter DNA methylation as determined by pyrosequencing and sodium bisulfite DNA sequencing of the samples shown in A-D. Pyrosequencing of the BORIS promoter region was performed as described in Materials and methods; the regions analyzed are shown in Figure 2B. The data shown represents the average methylation level of the 14 sequenced CpG sites. For bisulfite sequencing, the percentages indicate the average methylation level of the 32 sequenced CpG sites, taking into account all sequenced alleles. Error bars correspond to 1 SD. (F) BORIS expression was measured in the indicated samples using qRT-PCR. BORIS expression was normalized to GAPDH. Triplicate data points are plotted, and error bars correspond to 1 SD.

