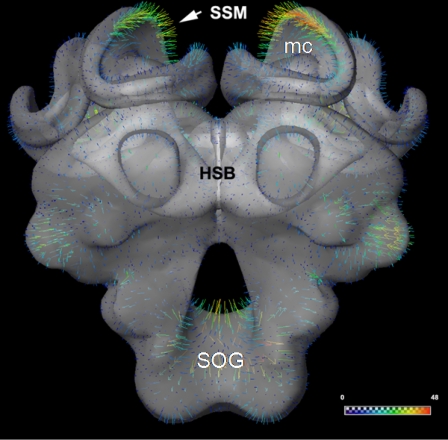
Figure 8.
A comparison of the iterative average shape brain (HSB) and the statistical shape model (SSM). The mean surface distance measured after rigid registration of HSB onto the SSM amounts to 8.5 μm. Only the surface model of the HSB is shown here, and the surface distances between HSB and SSM are indicated by colored vectors (arrow and false-color scale bar). Note the particularly large distance at the median calyx (MC) and subesophageal ganglion (SOG), which might be due to the stronger shrinkage process caused by the different histological procedures employed for the two models (see section “Methods” and text).

