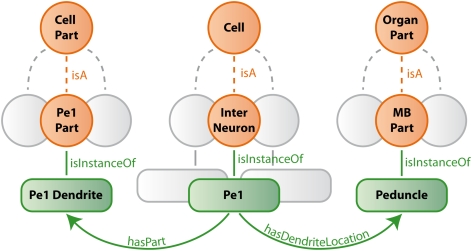
Figure 9.
Schematic description of bee brain ontology (with the Pe1 neuron as an example). Orange circles symbolize classes which represent summarizing concepts of structures with similar properties. Green rounded squares symbolize instances of classes which are connected by green edges (relations) to each other. Gray structures indicate that only a small selection is presented.

