
Fig. 6.
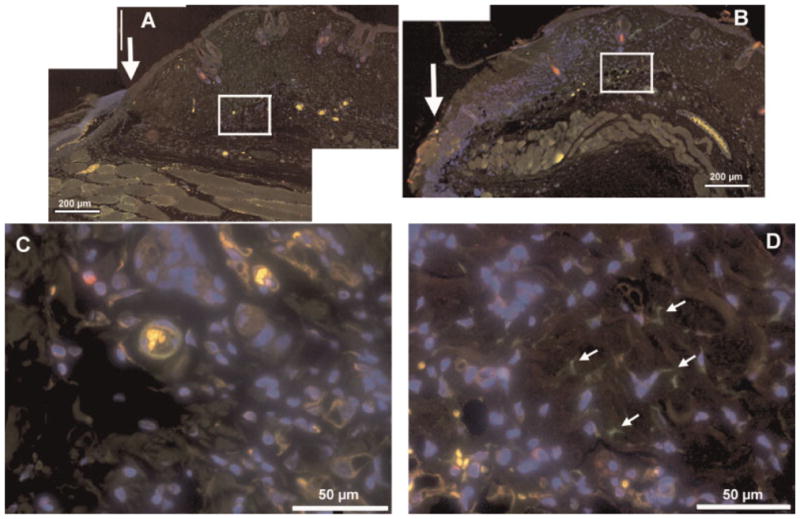
Immunofluorescence of tissue sections removed from control wounds and from illuminated wounds. Composite low magnification (10×) immunofluorescence images of mouse wounds 1 day after wounding; (A) control wound, (B) wound treated with 820-nm light as described. Arrow indicates the wound edge, scale bar is 1 mm. The areas in the white squares are shown in higher magnification (40×) for control (C), and illuminated (D) wounds, respectively. Scale bar is 200 μm for 10× and 50 μm for 40-X, arrows indicate green only stained cells proposed to be SMA-positive myofibroblasts in illuminated wounds (panel D).