
Figure 4.
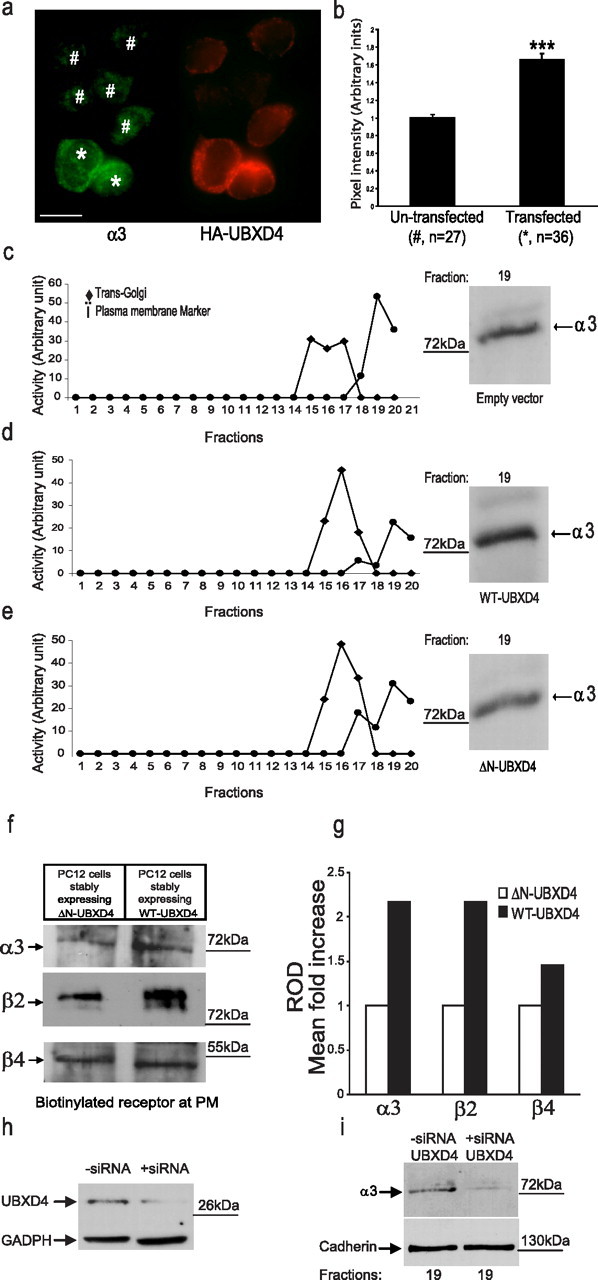
UBXD4 upregulates plasma membrane levels of α3* nAChRs. a, The fluorescent signal for α3 (green) increased when differentiated PC12 cells were transiently transfected with HA-tagged UBXD4 (red). The left panel shows the levels of α3 signal at the PM of UBXD4-overexpressing cells (*) compared with those of cells expressing endogenous levels of UBXD4 (#). Expression levels of UBXD4 where detected in the same cells with an anti-HA antibody after permeabilization (right panel). Confocal scale bar, 10 μm. b, Densitometric analysis of green pixel density in 63 cells (27 untransfected and 36 transfected) showed a significant increase in the total levels of α3 (p < 0.001). c–e, Differentiated PC12 cells stably expressing the corres-ponding empty vector (c), WT-UBXD4 (d), or ΔN-UBXD4 (e) were subjected to 8–34% linear iodixanol gradient fractionation. Enzymatic activity assays following iodixanol gradient fractionation were used to identify the fractions containing the Golgi and PM compartments (left panels). The fraction containing the highest levels of PM (fraction 19) showed increased levels of α3 upon overexpression of UBXD4 (right panels). ΔN-UBXD4 overexpression had no effect on α3 PM levels. f, Biotinylation experiments confirmed that expression of WT-UBXD4 but not ΔN-UBXD4 (control) greatly increases the surface levels of the α3 and β2 nAChR subunits. g, Quantitation of the data shown in f indicated that α3 and β2 levels increased 2.2-fold while β4 levels increased 1.4-fold compared with control. h, Stable expression of UBXD4 siRNA in PC12 cells decreased UBXD4 expression. i, The reduction in UBXD4 levels led to a significant decrease in α3 levels in PM fractions. The above experiments were conducted twice with similar results each time.