Figure 1.
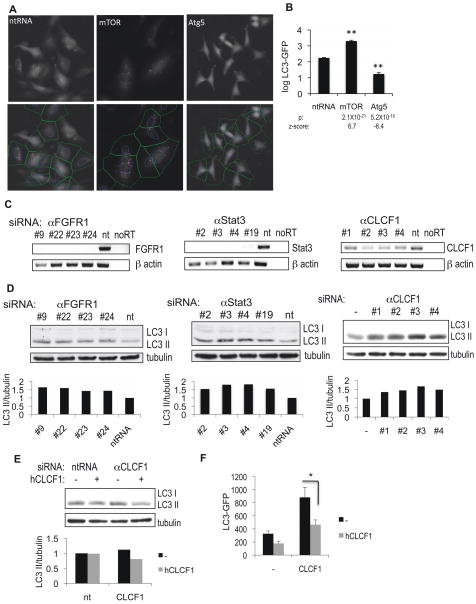
High-throughput image-based screen for genes regulating autophagy. A, H4 cells stably expressing LC3-GFP were transfected with non-targeting siRNA (ntRNA) or siRNA against mTOR or Atg5 for 72h, fixed, counterstained with Hoechst and imaged on a high-throughput fluorescent microscope (10×). The bottom panels demonstrate results of image segmentation used for quantification of the ratio of soluble (diffuse cytosolic) versus autophagosome-associated (punctate) LC3-GFP: blue – nuclei, green – cell segmentation, pink – autophagosomal LC3-GFP. B, Quantification of data from (A). C, Confirmation of knock-down of selected screen hits by RT-PCR. H4 cells were transfected with indicated siRNAs for 72h. D, Confirmation of changes in levels of autophagy following knock-down of FGFR1, Stat3 or CLCF1 by western blot with antibodies against LC3. 10 μg/mL E64d was added to the media for 8 hours before cells were harvested. Quantification of LC3 II/tubulin ratio is shown. E–F, Exogenous CLCF1 can suppress increase in autophagy induced by knockdown of CLCF1. H4 (E) or H4 LC3-GFP (F) cells were transfected with non-targeting siRNA (nt) or siRNA against CLCF1 and grown in the absence or presence of 100 ng/mL human CLCF1. Levels of autophagy were assessed by western blot (E) or by quantification of autophagosomal LC3-GFP (F). All error bars are s.e.m. * p=0.05 based on two-tailed student t-test. n≥10

