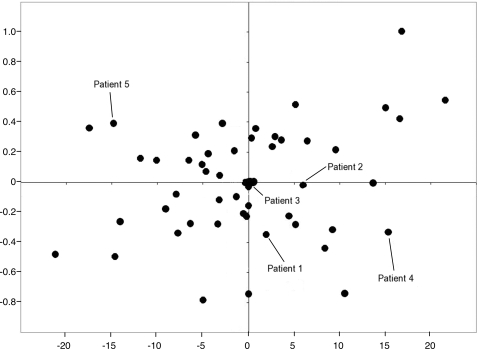
Figure 3.
Comparison of residual values from the visual acuity and visual field regression analyses. The residual values from the visual acuity regression analysis are given on the x-axis, while those of the visual field regression analysis are given on the y-axis. Individuals represented to the left of the y-axis have visual fields that are better than expected for their genotype while those to the right of the y-axis have visual fields that are worse than expected. Individuals above the x-axis have visual acuities that are poorer than expected for their genotype, while individuals below the x-axis have visual acuities better than expected. The residuals of the five patients depicted in Figure 5 are specifically labeled. The R2 value for these data is 0.06.

