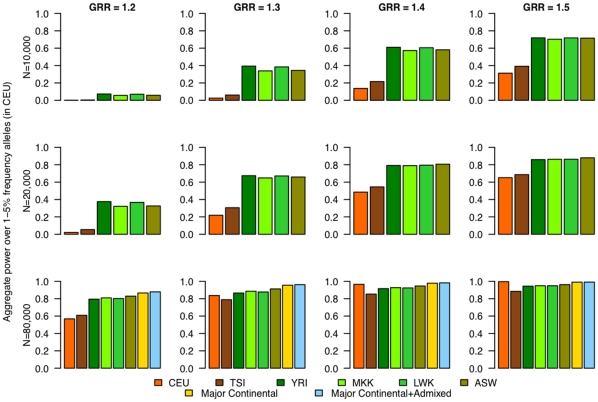
Figure 1. Power to detect association for lower-frequency alleles (≤5%) in CEU based on HapMap 3 data.
Power is given for various individual population panels (CEU, TSI, YRI, MKK, LWK, and ASW), a panel with major continental representation (CEU+CHB+YRI) and a cosmopolitan panel with major continental representation and admixed populations (GIH, MXL, and ASW) interrogated in phase 2, aggregated over those alleles that have lower frequency (1–5%) in CEU.

