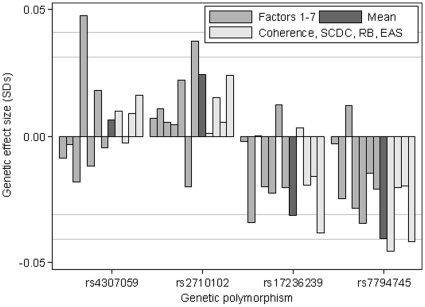
Figure 3. Genetic associations with the traits.
The figure shows the associations for the four genetic markers with the traits (N = 7959–8436 for factors and Factor mean score; 7324–7760 for individual measures). Effect sizes are reported as a proportion of a SD for each outcome for each copy of the minor allele. Approximate 5% and 1% grid lines are shown.

