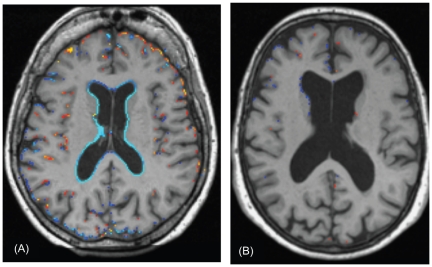
Figure 4. Selected subtraction MRI scans.
The images are from the baseline scan with colour superimposed to show the brain tissue change over the following two years. Colours show expansion (red/yellow) or contraction (blue/light blue) of the brain of 0.3 to 1.0 mm, with the lightest colour indicating the biggest change. (A) Subtraction image of female participant in the placebo group, age 79 years, with baseline tHcy of 22 µmol/L, whose tHcy concentration increased by 8 µmol/L over two years. Atrophy rate was 2.50% per year. Atrophy most strongly appears here as enlargement of the ventricles. (B) Subtraction image of female participant in active treatment group, age 72 years, with baseline tHcy of 24 µmol/L at baseline, whose tHcy concentration decreased by 12 µmol/L over two years. Atrophy rate 0.46% per year. There is no clear visible pattern of atrophy.

