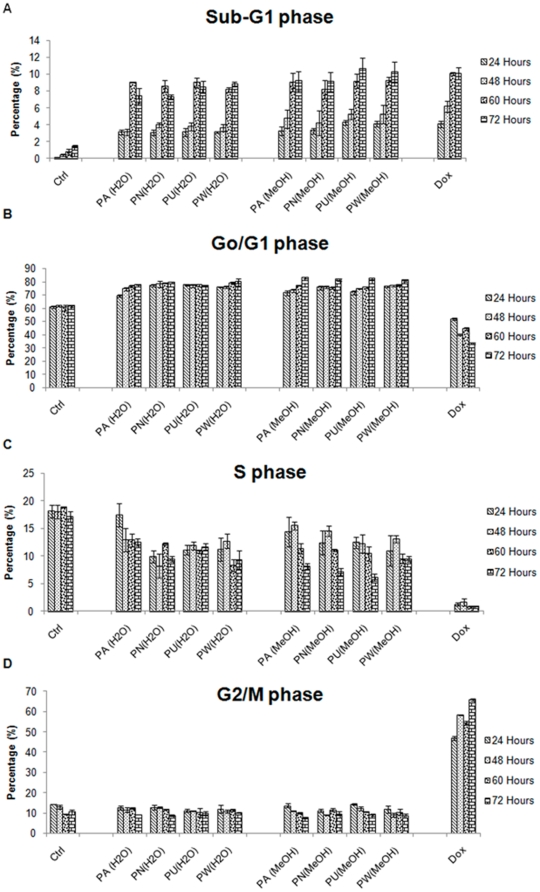
Figure 6. The kinetics of cell cycle distribution of Phyllanthus extracts treated PC-3 cells.
The percentage of Phyllanthus extracts-treated cells at A) Sub-G1, B) Go/G1, C) S, and D) G2/M phases of PC-3 cells at different time intervals (24, 48, 60 and 72 hours) of treatment Bars show the mean percentage ± SE

