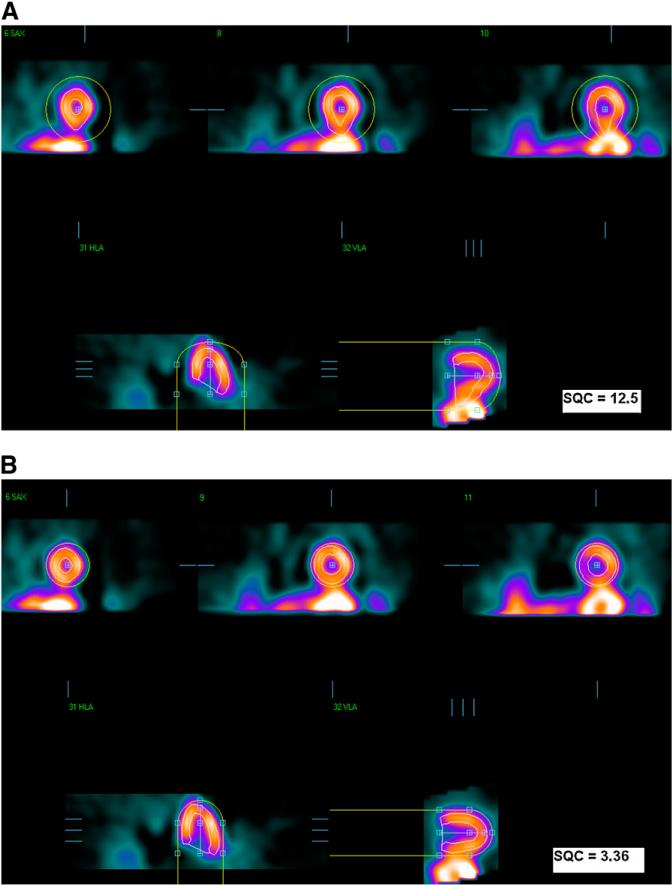
FIGURE 1.
Mask-failure case. (A) Failed segmentation results. (B) Correct result after manual changes to initial mask. In each image, top images are in short-axis orientation, and bottom images are in vertical- and horizontal (long)-axis orientation. Yellow circles show initial masks, and LV contours are shown in white.

