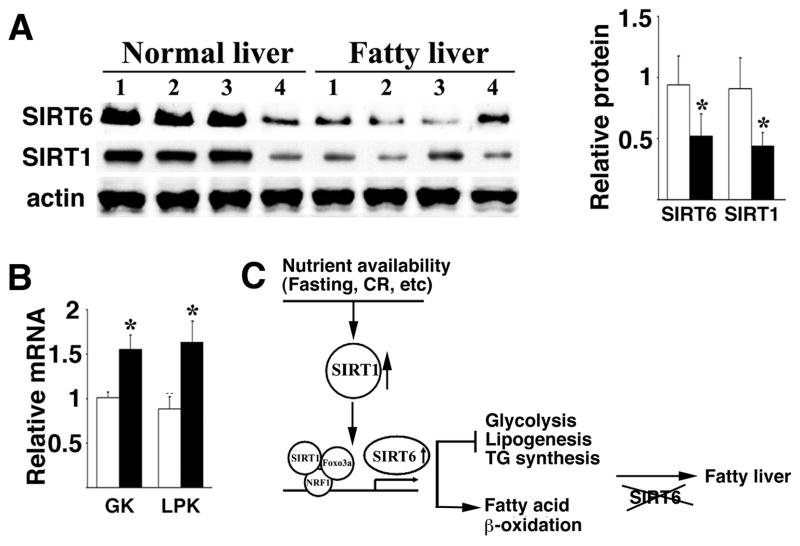
Fig. 7.
Reduced levels of SIRT1 and SIRT6, and increased levels of GK and LPK in human fatty liver samples. A, Western blot analysis of protein levels of SIRT1 and SIRT6 in fatty liver samples. Quantification of gel intensity of 8 normal livers and 8 nonalcoholic fatty livers was shown in right. B, mRNA levels of GK and LPK revealed by Real-Time RT-PCR in these samples. The fatty livers and controls were provided by the Liver Tissues Procurement and Distribution System (University of Minnesota). C, An integrated model for functions of SIRT6 in inhibiting fatty liver formation through regulation of glycolysis and lipid metabolism. SIRT6 deficiency, consequently, results in fatty liver fomation.

