Figure 3.
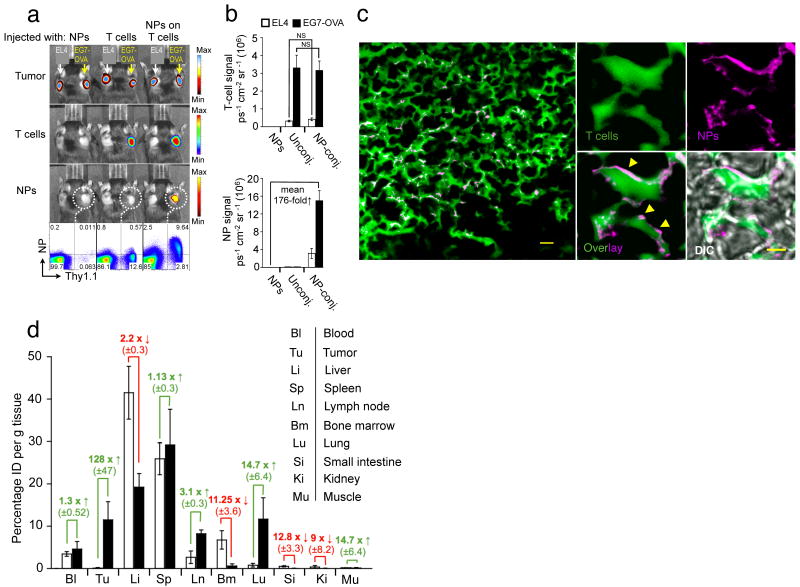
Nanoparticle-decorated T cells efficiently carry surface-tethered NPs into antigen-expressing tumors. (a,b) Comparative whole-animal in vivo bioluminescence (tumors, T-cells) and fluorescence imaging (NPs) of mice bearing established s.c. Gaussia luc-expressing EG7-OVA and EL4 tumors on opposite flanks, two days after i.v. infusion of firefly luc-transgenic Thy1.1+ effector OT-1 T-cells (with or without attached DiD-labeled NPs), or an equivalent number of free NPs. Thy1.1+ OT-1 T-cells recovered from the EG7-OVA tumors were analyzed for surface-bound DiD NPs by flow cytometry (a), and the mean bioluminescent T-cell and fluorescent NP signals from groups of 6 mice are shown in (b). NS, no significance. (c) In an independent experiment, CellTracker green-labeled OT-1 T-cells conjugated with rhodamine-labeled NPs were transferred into mice bearing established s.c. EG7-OVA tumors, and tumors were excised and sectioned for confocal histological analysis two days later. Scale bar, 10 μm. A higher magnification image of NP-carrying tumor infiltrating T-cells is shown in the right panel. Scale bar, 1.5 μm. Yellow arrowheads highlight evidence for surface localization of NPs. Shown is 1 of 2 independent experiments. (d) Groups of 3 C57Bl/6 mice bearing s.c. EG7-OVA tumors were i.v. injected with 15 × 106 OT-1 effector T-cells bearing surface-conjugated with DiD-labeled NPs (100 NPs/cell, filled bars), an equivalent number of DiD-labeled particles alone (open bars). After 48 h indicated tissues were removed, weighed, and macerated with scissors. We quantified specific DiD tissue fluorescence for each organ using the IVIS Spectrum imaging system and calculated the mean percentage of injected dose per gram of tissue (%ID g-1) as final readout (d). Data shown are pooled from three independent experiments.

