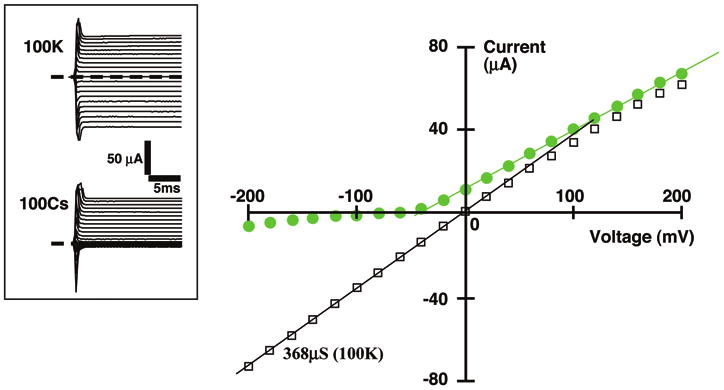
Figure 3.

Whole-cell current-voltage relations for wt-Kir1.1b, with either 100 mM extracellular K (black) or 100 mM extracellular Cs (green). Currents were measured on the same oocyte in response to applied clamp voltages between -200 mV and +200 mV. Oocyte internal [K] was approximately 100 mM and acetate buffers were used to clamp the oocyte internal pH at 7.8. Inward conductances reflect either Cs (green) or K (black) permeation. Outward conductances reflect flow of K out of the oocyte. Inset shows raw data.
