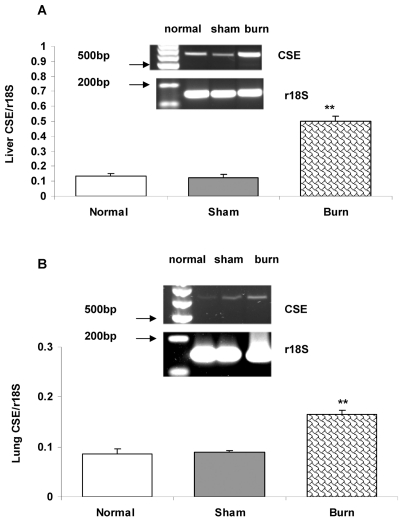
Figure 2.
Liver (A) and lung (B) CSE mRNA expression in normal, sham and burn group (n = 5 animals/group). Mouse 18S RNA is shown as a control. The bar graph shows the quantification of band intensity. Data were normalized to controls and expressed as fold-change ratio to control levels. **P < 0.01 when mice subjected to burn injury were compared with sham group.

