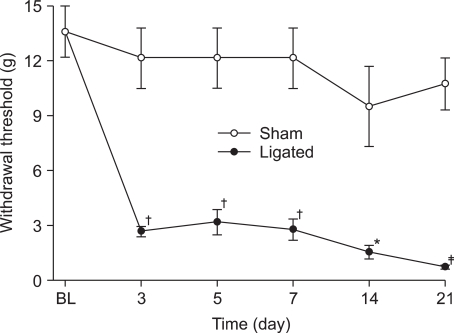
Fig. 1.
Time course of the hindpaw-withdrawal response to von Frey filament stimulation after spinal nerve ligation. Data are presented as withdrawal threshold (g). Each line represents mean ± SEM of 8 rats. BL: baseline withdrawal threshold measured before spinal nerve ligation. Significant differences between the spinal nerve-ligated and sham-ligated groups are indicated. *P < 0.05, †P < 0.01, ‡P < 0.001 vs. sham.

