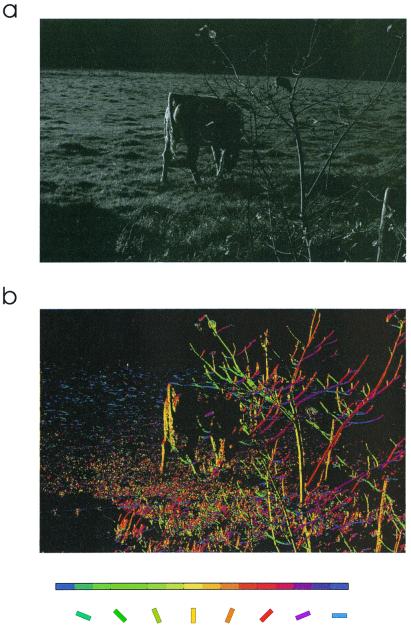
Figure 1.
An example of the filtering process we applied to an image. (a) The original image. (b) The image after processing with local-oriented filters (66). The maximal orientation was calculated at each point. The image was converted to binary by considering char “oriented” only the pixels that, after being filtered at their maximal orientation, exceeded a given threshold. In the figure, the maximal orientation is shown by using a color code.

