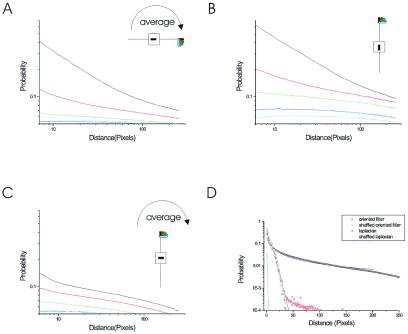
Figure 2.
Scaling behaviors for different geometrical configurations. (A) The number of cooccurrences between two segments in the relative positions within the line that the orientation of the first segment spans is shown for different orientations of the second segment. This measure was averaged over all possible orientations of the first segment. The collinear configuration is the most typical case and displays a scale invariant behavior as indicated by the linear relationship in the log–log plot. (B) The strength of the correlation and the degree to which it can be approximated to a power law are more pronounced for the particular case in which the reference line segment is vertical. (C) The same measure when the two segments are at a line 90° apart from the orientation of the first segment. In all three cases, black corresponds to iso-orientation, red to 22.5° with respect to the first segment, green to 45°, blue to 67.5°, and yellow to 90°. (D) Full crosscorrelation as a function of distance for Laplacian filtering (red circles), oriented filters in the collinear vertical direction (black circles), and for both cases after shuffling the images. The Laplacian filtered image is decorrelated, as can be seen from the fact that it shows the same structure as its shuffled version (cyan circles). Collinear configuration shows long-range correlations, which follow a power law of exponent 0.6 (blue line, y = x−0.6) and are not present when the image is shuffled (green circles).

