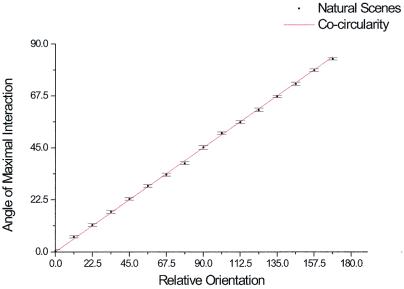
Figure 5.
Quantitative analysis of the spatial maps. Orientation of the axis where cooccurring pairs of oriented elements of relative orientation (ξ = ψ − ϕ) are maximized. The axis of maximal probability was calculated relative to the orientation of the segment in the center (ψ). This was done for the 16 possible orientations of (and the corresponding values of ϕ = (ψ + ξ)(modulo16), and we computed for each the mean and standard error. The solid line corresponds to the solution predicted by the cocircular rule.

