Figure 3.

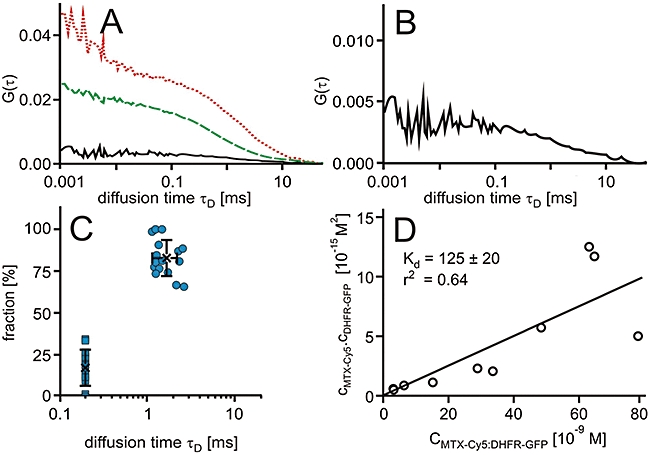
Interaction of methotrexate (MTX)-Cy5 in HeLa cells expressing green-fluorescent protein fusion proteins of dihydrofolate reductase (DHFR-GFP). (A) Characteristic autocorrelation functions for DHFR-GFP (dashed line, green) and MTX-Cy5 (dotted line, red) and the cross-correlation function for the DHFR-GFP : MTX-Cy5 complex (solid line, black). (B) Characteristic cross-correlation function at a larger scale. (C) Scatter plots of relative contributions to the autocorrelation function versus diffusional autocorrelation times derived from fits to the autocorrelation functions with an algorithm comprising two diffusing components in which the diffusion time τD of the low-molecular weight fraction was fixed to 200 µs. Averages (cross) and standard deviations are indicated. (D) Plot of the concentrations of the free molecules against the concentration of the complex and a linear regression.
