
Figure 5.
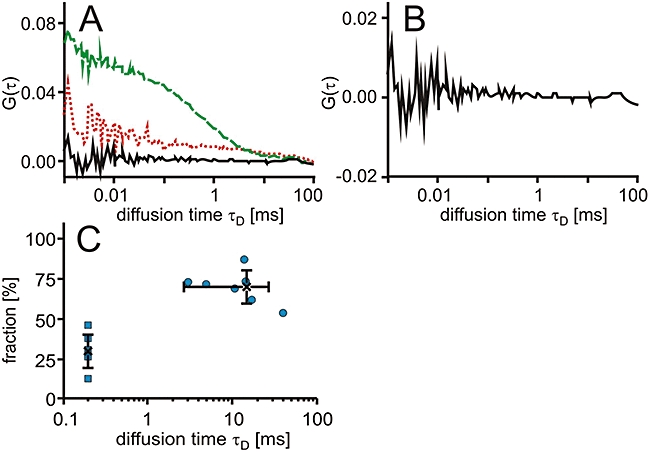
Interaction of PD-Cy5 in cells. T-REx-293 cells expressing ABL1-GFP were electroporated with PD-Cy5. (A) Characteristic autocorrelation functions for ABL1-GFP (dashed line, green) and PD-Cy5 (dotted line, red) and the cross-correlation function (solid line). (B) Characteristic cross-correlation function at a larger scale. (C) Dot plot of the relative contribution to the autocorrelation amplitude versus diffusional autocorrelation time τD for PD-Cy5 with the fast component fixed to 200 µs with averages (cross) and standard deviations.