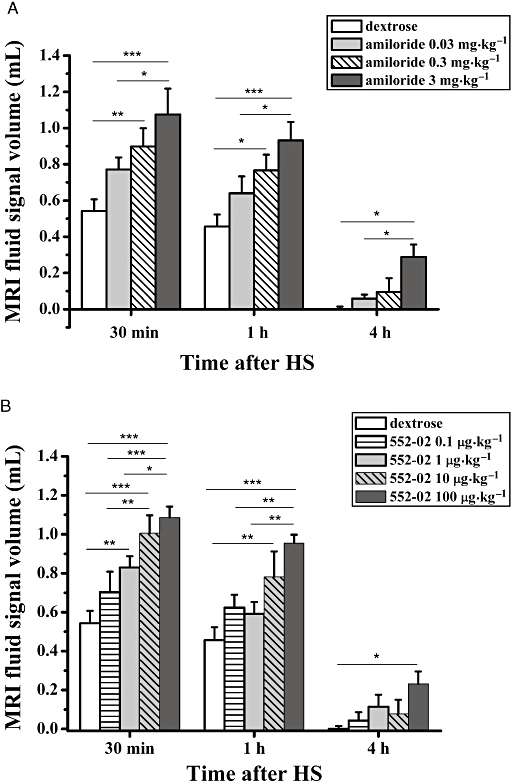
Figure 3.

Volumes (means ± SEM, n= 6 animals per group) of fluid signals detected by MRI in the lungs of BN rats, at 30 min, 1 h and 4 h following i.t. administration of HS (1.5% NaCl, 0.2 mL). Rats had received either vehicle (dextrose 5%, 0.2 mL) (A) amiloride or (B) 552-02 at the specified dose (0.2 mL solution volume), 20 min before saline. The levels of significance *0.01 ≤P < 0.05, **0.001 ≤P < 0.01 and ***P < 0.001 correspond to extended anova comparisons. HS, hypertonic saline; MRI, magnetic resonance imaging.
