
Figure 3.
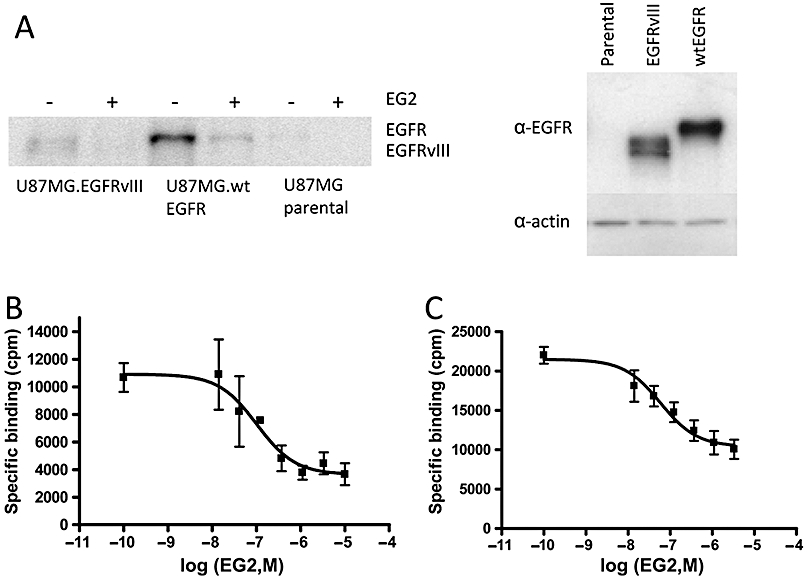
EGFR and EGFRvIII expressed on U87MG cell lines were affinity labelled with [125I]-EG2 in the absence and presence of 100-fold excess unlabelled EG2 (A, left). The resulting bands were competed for by unlabelled sdAb and corresponded to the expected molecular weight as confirmed by Western blot (A, right). IC50 values were calculated by fitting [125I]-EG2 cell binding data to a one-site competition model using non-linear regression. For monovalent EG2 binding to EGFR on the surface of U87MG.wtEGFR cells, the average IC50 was 7.04 ± 2.67 × 10⁻⁸ M (B). Similarly, the average IC50 on U87MG.EGFRvIII cells was 5.98 ± 0.12 × 10⁻⁸ M (C).