
Figure 3.
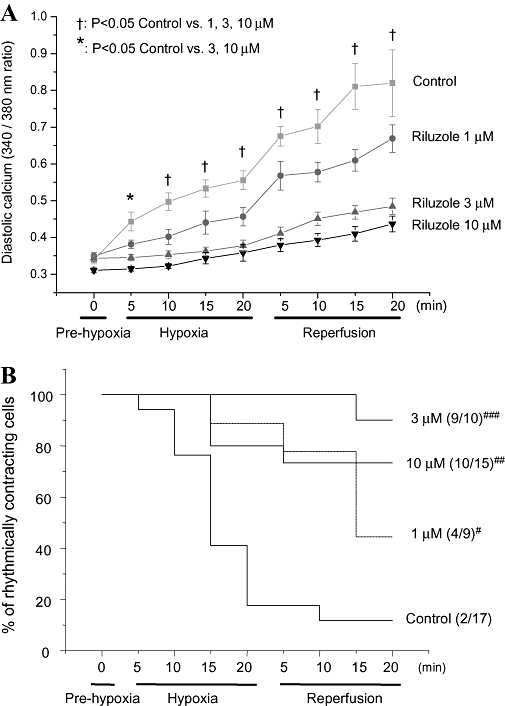
[Ca2+]i and cell shortening-pooled data. (A) Pooled data on the time course of the change in 340/380 fluorescence ratio during the experiment. The x-axis is continuous – the horizontal bars indicate the experimental protocol, with the time in each condition. ‘n’ (number of cells) for each condition and for control, 1, 3 and 10 µM were: Prehypoxia, 17, 9, 10, 15; hypoxia 9, 8, 10, 13; reperfusion 7, 7, 10, 13. Data was analysed with two-way analysis of variance; the symbols indicate the statistical significance as indicated. (B) The proportion of cells rhythmically contracting during the time course of the experiment for each of the concentrations of riluzole. The numbers of cell contracting at 20 min reperfusion was compared using an overall exact chi-squared test (3 d.f.: P < 0.001), then pairwise comparisons between the control and each concentration group using a Fisher exact test (two-sided). Significance is indicated by # (=0.138), ## (=0.003) and ### (<0.001).