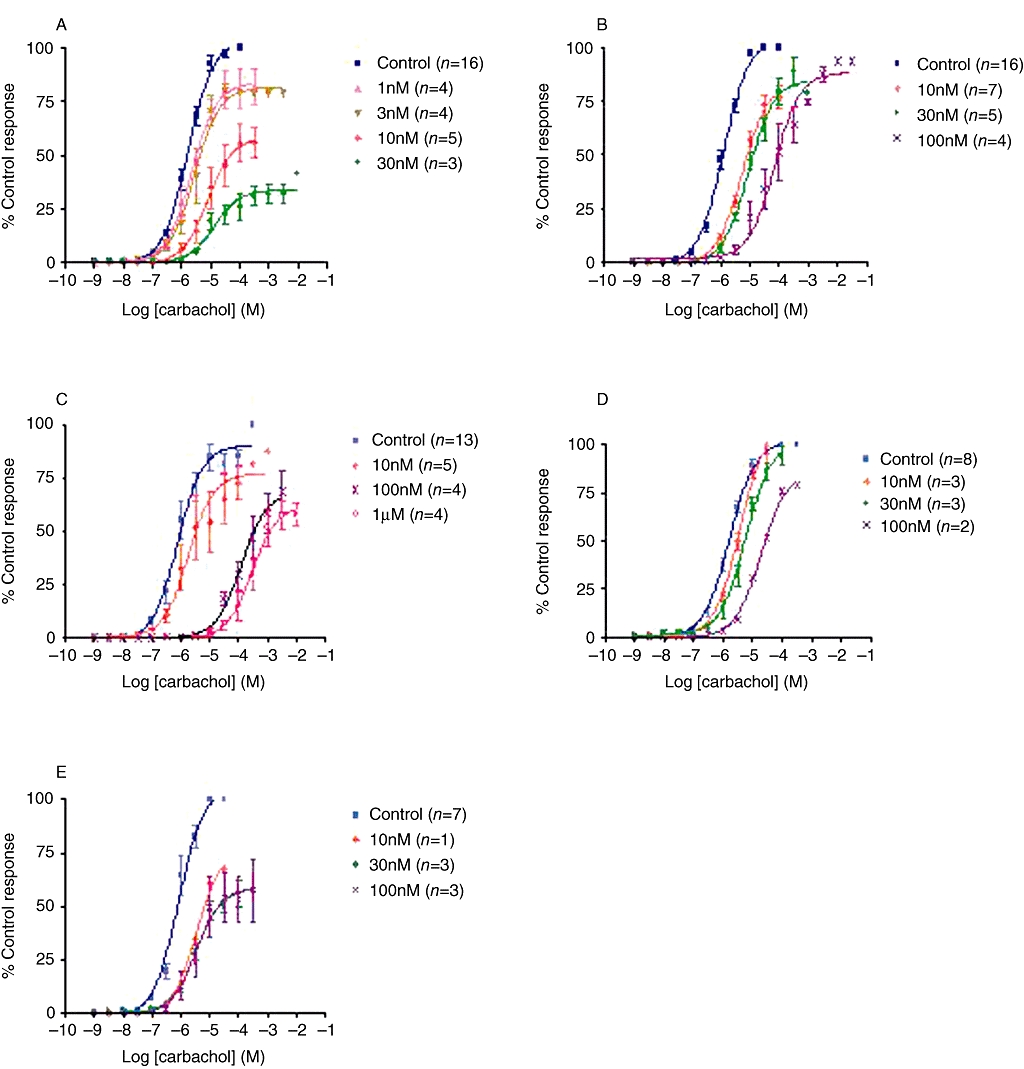
Figure 1.

Double cumulative concentration response curves to carbachol-evoked contractions in strips of rat bladder. Data are expressed as % maximum response in control tissue. Each data point represents mean ± SEM of the number of experiments shown in parentheses. (A) AE9C90CB, (B) tolterodine, (C) oxybutynin, (D) solifenacin and (E) darifenacin all produced concentration-dependent rightward shifts in the concentration response curve to carbachol in rat bladder strips.
