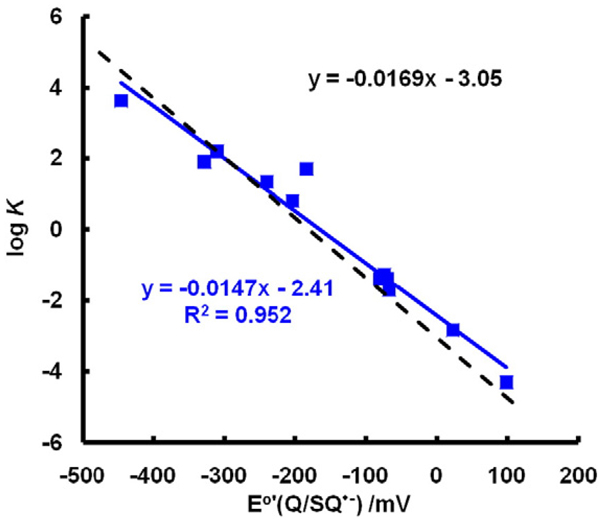
Fig. 6.
Experimental equilibrium constants match theoretical equilibrium constants closely. The dashed black line represents the theoretical values of K for Eq. (7) using the Nernst equation (Eq. (7)) with ; the slope of this line is 1/(59.1 mV) and the intercept is (−180 mV)/(59.1 mV). The variation in the experimental values represents the uncertainties of measurement. (Solid line, a fit of experimental data by linear regression.) However, if the very fast reactions of Eq. (7) are influenced by limitations from diffusion, then the largest forward rate constants are lower than theoretical rate constants, resulting in the corresponding Ks being underestimated. Likewise, when E°′(Q/SQ•−) is very positive, the experimental, very fast rate constants for the reverse reactions of Eq. (7) are lower than theoretical rate constants and, thus K would be overestimated. These two extremes may account for the shallower slope and the underestimation of the intercept for experimental values.

