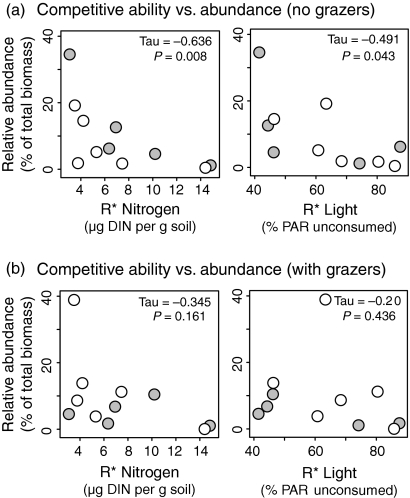
Fig. 3.
The relationship between competitive ability for nitrogen and light (R*– resource concentrations in monoculture) and relative abundance as biomass in ungrazed (a) and grazed mixtures (b). Lower values of R* indicate greater competitive ability for that resource. Each circle represents one of five native (grey) or six exotic (white) species. P-values and Kendall’s τ are based on two-tailed tests; Kendall’s τ is a measure of association between ranked variables. Results are similar for relationships between R* for nitrogen and light and relative abundance in seed mass (results not shown).

