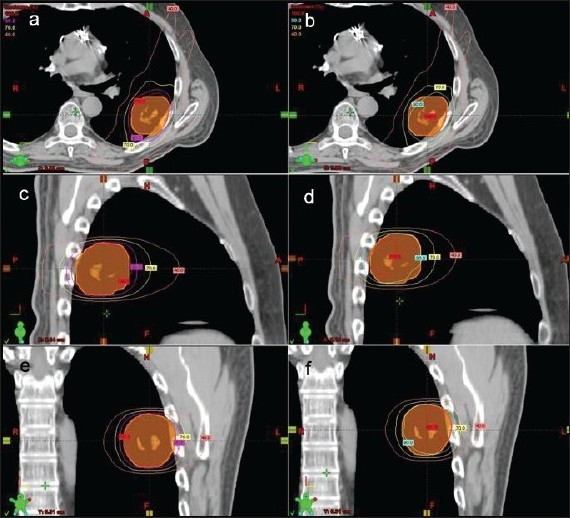
Figure 3.

Transverse views of isodose distribution curves derived from heterogeneity corrected (a) and non-corrected plans (b); sagittal views from heterogeneity corrected (c) and non-corrected plans (d); and coronal views from heterogeneity corrected (e) and non-corrected plans (f) of a typical non-small cell lung cancer patient
