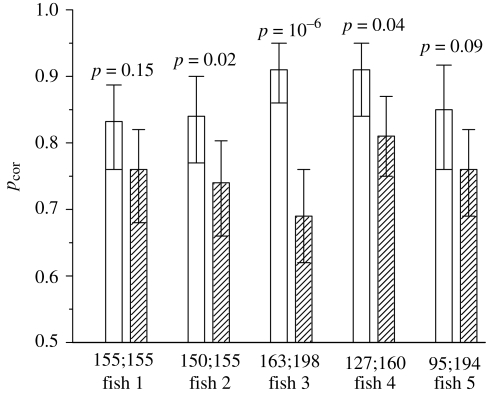
Figure 2.
Proportion of correct choices (pcor) in discriminating ‘magenta’ stimulus from ‘blue’ stimulus (open bars) and ‘magenta’ stimulus from ‘purple’ stimulus (dashed bars). Error bars indicate 95% confidence intervals (binomial test). Numbers above the bars indicate the probability of ‘magenta’–‘blue’ pair and ‘magenta’–‘purple’ pair being discriminated equally easily by each individual fish (Fisher's exact test). Numbers below the bars indicate the number of trials in each experiment.

