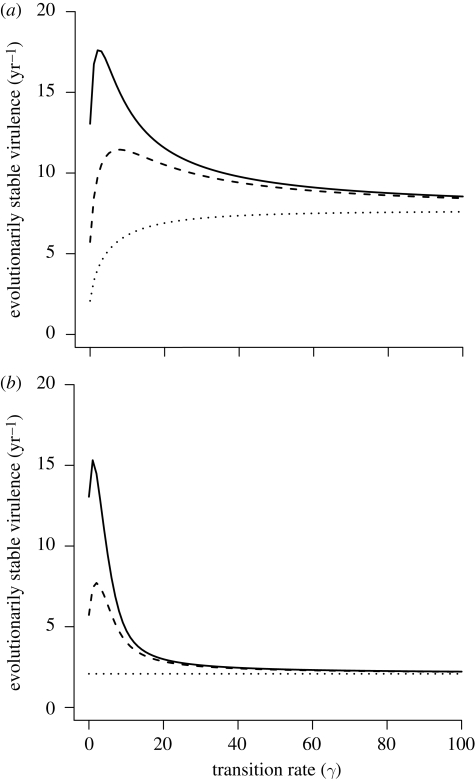
Figure 2.
The relationship between evolutionarily stable virulence (α) and the transition rate between the infected classes (γ) for three levels of relative virulence (ρ) with and without recovery (σ) from the second infected class. In (a) there is recovery (σ = 10) and in (b) there is no recovery (σ = 0). Solid line, ρ = 0.01; dashed line, ρ = 0.1; dotted line, ρ = 1. For both, ϕ = 1 and other parameters are as in figure 1.

