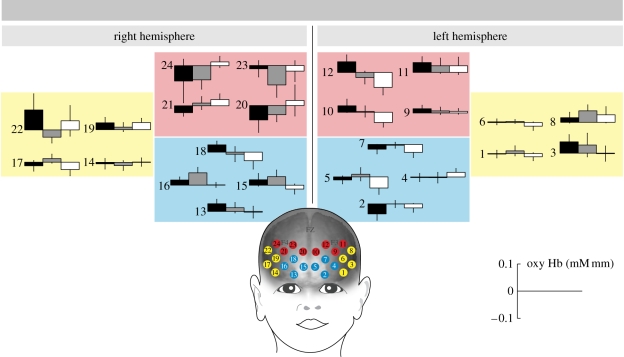
Figure 1.
Prefrontal brain responses measured in five-month-old infants. This graph depicts mean oxygenated haemoglobin concentration changes (±s.e.m.) during the joint attention, no referent and no eye contact conditions measured from 24 NIRS channels within dorsal, ventral and lateral ROIs. Black shaded box, joint attention; light grey shaded box, no referent; white box, no eye contact; red, dorsal; yellow, lateral; blue, ventral.

