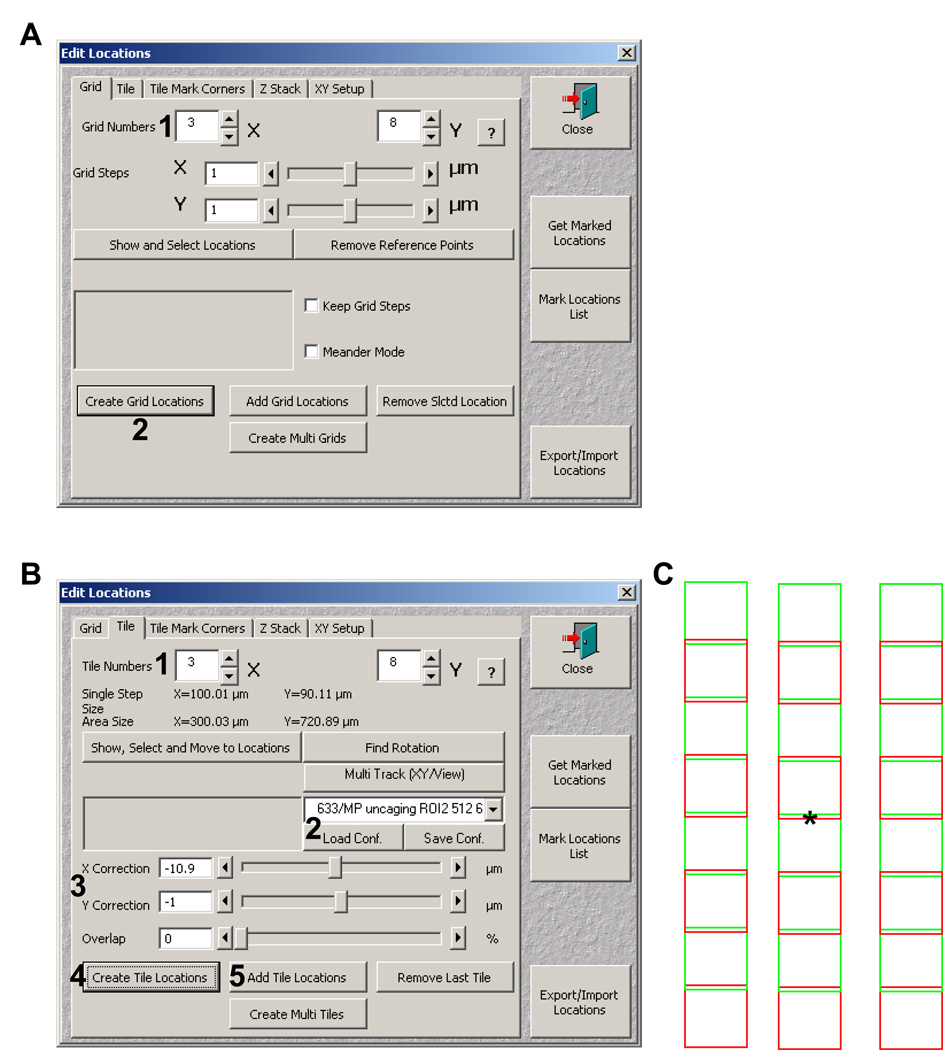
Figure 20.
Tiling with Edit Locations window. A) The Edit locations window grid tab showing the grid number dialog (1) and the create grid locations button (2) for grid generation. B) The Edit locations window tile tab with tile numbers (1), configuration (2), XY correction (3), and Create tile locations (4) highlighted. C). Schematic representation of the tiled grid generated based on the parameters shown in panel B. The asterisk represents the marked positions chosen in the Stage and Focus control window.

