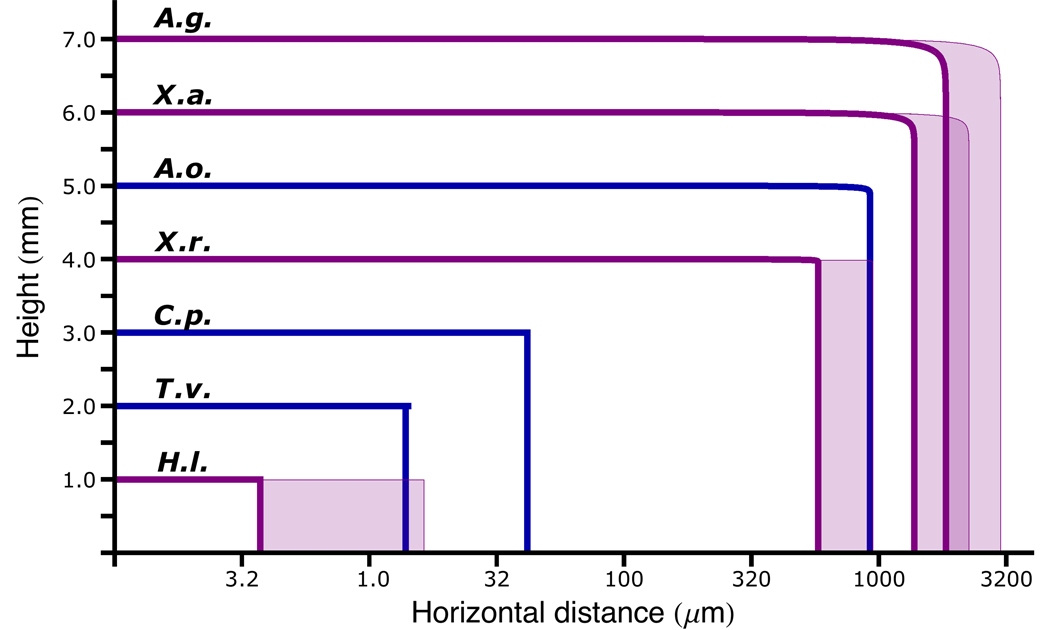
Fig 4.
Calculated trajectories of ballistospores based on high-speed video recordings and mathematical modeling. In order to accommodate the nearly 1000-fold span of horizontal ranges, the horizontal distance (in µm) is displayed on a log scale. The spores were launched from arbitrary heights for clarity in this figure. Species: A.g., Aleurodiscus gigasporus; X.a., Xerula australis; A.o., Aleurodiscus oakesii; X.r., Xerula radicata; C.p., Clavicorona pyxidata; T.v., Trametes versicolor; H.l., Hyphodontia latitans. Velocity measurements obtained from video recordings for flights shown in blue (A.o., C.p., T.v.); other trajectories (in purple) based on extrapolation from these measurements. Buller’s drop volume was assumed to scale in proportion to the spore volume; drop size estimates for A.g., X.a., and H.l. were based on measurements from A.o., X.r., and T.v. respectively. The same species comparisons informed estimates of the fraction of surface tension energy that was converted to kinetic energy, but the effect of increasing the energy fractions to 25% are indicated by the shaded regions of the trajectories.

