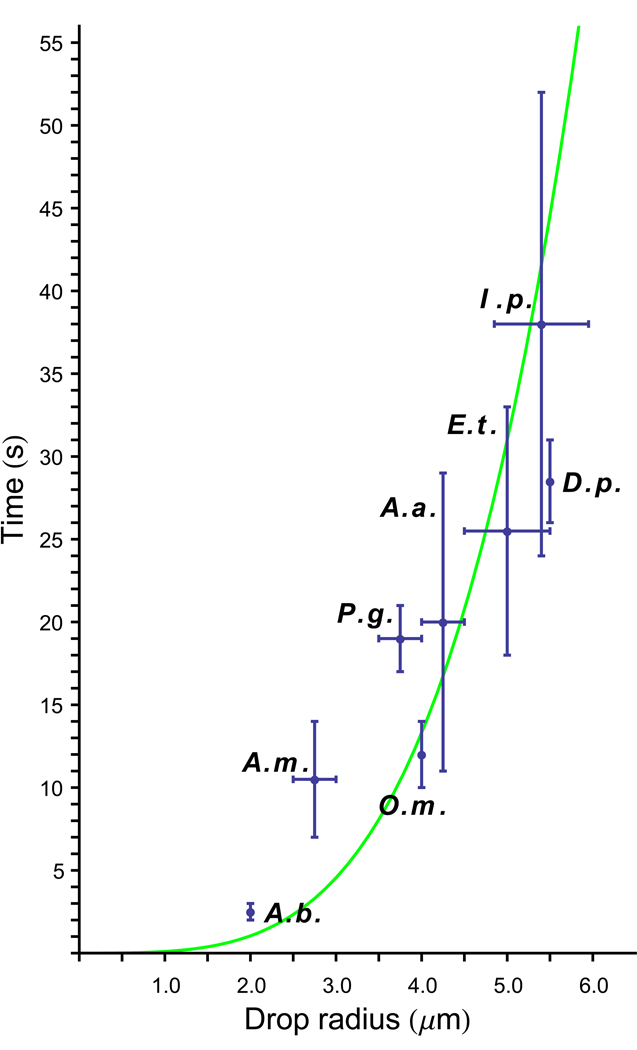
Fig 5.
Relationship between the maximum size of Buller’s drop and time for its formation in variety of Basidiomycota. Data from Webster et al. (1989). Species: A.a., Auricularia auricula; A.b., Agaricus bisporus; A.m., Auricularia mesenterica; D.p., Ditiola peziziformis; E.t., Exidia thuretiana; I.p., Itersonilia perplexans; O.m., Oudemansiella mucida; P.g., Puccinia graminis. Error bars indicate the range of drop sizes and formation times. Data fitted to a quartic function (green curve) showing that the time required for drop formation increases approximately as the fourth power of the drop radius (P < 0.001).

