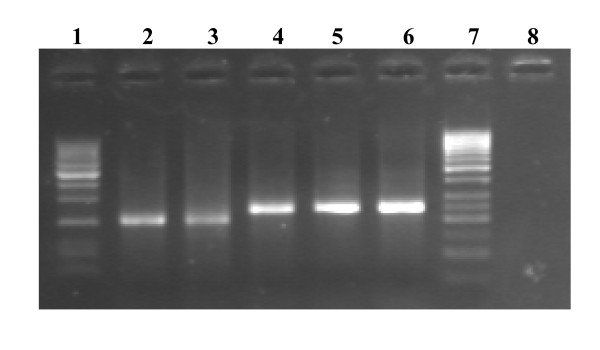
Figure 2.
Typical agarose gel electrophoresis patterns of PCR products from two different HCV genotypes. Lanes 1 and 7 showing 50-bp DNA size ladder maker; Lanes 2-3 showed HCV-1a specific bands (210-bp); Lane 4-5 showed HCV-3a specific band (258-bp), Lane 6 showed Positive Control (258-bp HCV-3a genotype-specific band) and Lane 8 showed Negative Control (No band).

