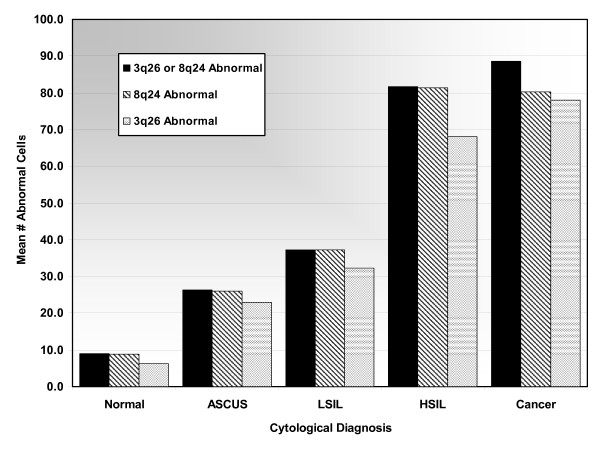
Figure 4.
Mean number of abnormal cells for each cytological category using 3q26 or 8q24, 8q24, and 3q26. The 3q26 or 8q24 Abnormal column (black) represents all cells found positive for either 3q26 or 8q24, the 8q24 Abnormal column (diagonal stripes) represents all cells found positive with 8q24, and the 3q26 Abnormal column represents all cells that were found positive by 3q26.

