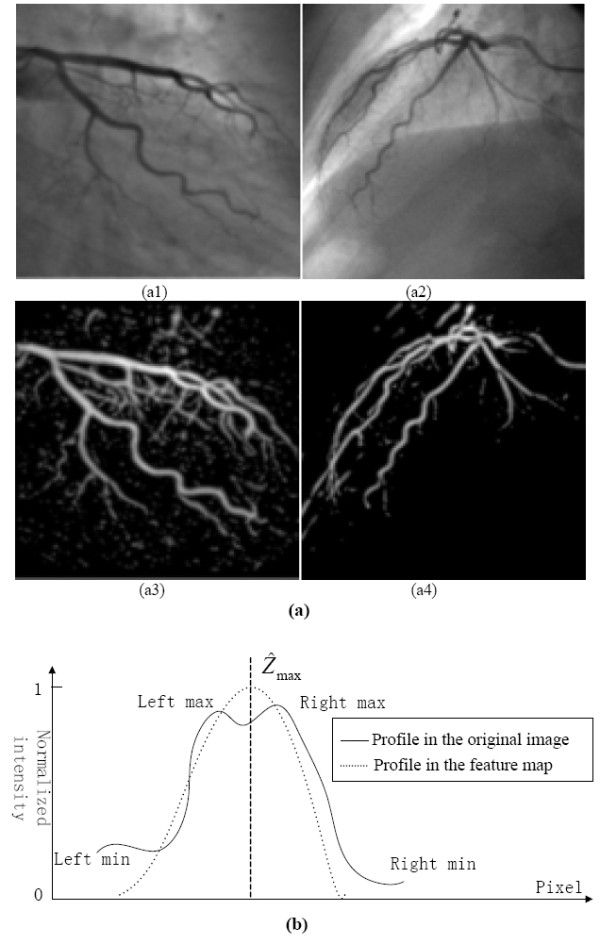
Figure 2.

Show the angiographic images, feature maps and the cross-sectional profiles of coronary artery. (a1) and (a2) depict two original angiographic images; (a3) and (a4) are their vessel feature maps, respectively. Subfigure (b) depicts the cross-sectional profiles of the vessel in the original image and in the corresponding feature map.
