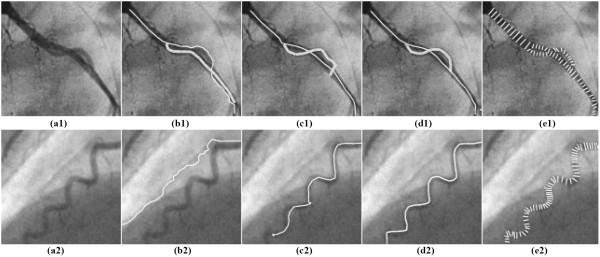
Figure 8.
Comparison of the results of vessel-tracking using the PTO based on different continuity terms. (a1) & (a2) two original images. (b1) & (b2) using the PTO simply based on qθ. (c1) & (c2) using the PTO based on qθ and qz. (d1) & (d2), using the PTO based on complete terms. (e1) & (e2), measuring the vessel diameters, respectively along the vessel paths in (d1) and (d2).

