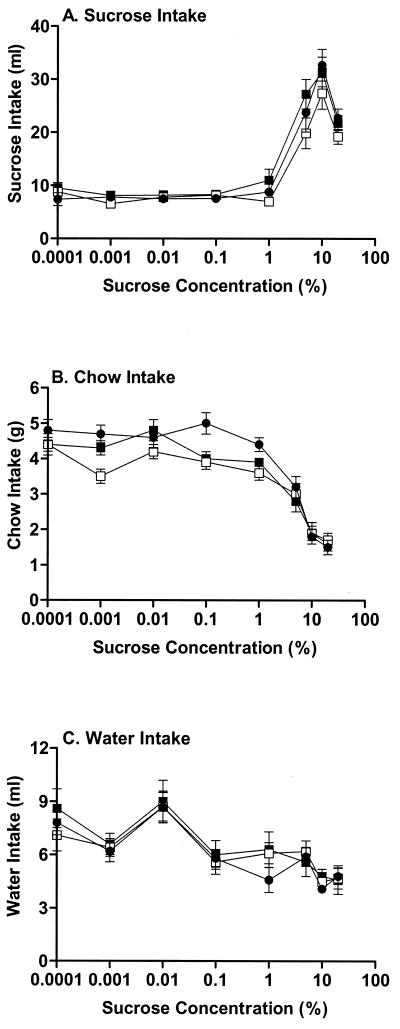
Figure 4.
Alterations (mean ± SEM) in sucrose (A), chow (B), or water (C) intake across a range (0.0001–20%) of sucrose concentrations in WT (dark circles), PPEKO (open squares), and HZ (closed squares) mice. As expected, significant increases in sucrose intake [ANOVA, F(8,48) = 334.38; Tukey's t test, P < 0.0001] and significant decreases in chow (F = 319.57, P < 0.0001) and water (F = 47.47, P < 0.0001) intakes were observed as a function of sucrose concentration. However, the patterns of each of the three types of intake across the sucrose concentrations failed to differ among genotypes [sucrose, F(2,30) = 2.76, P < 0.07; chow, F = 2.71, P < 0.083; water, F = 2.44, n.s.]. Although the second squad of animals consumed significantly more sucrose [F(2,12) = 29.42, P < 0.0001] and chow (F = 4.12, P < 0.044) and drank significantly less water (F = 27.71, P < 0.0001) than the first and third squads, these effects occurred consistently over all genotypes and failed to alter the genotype results.

