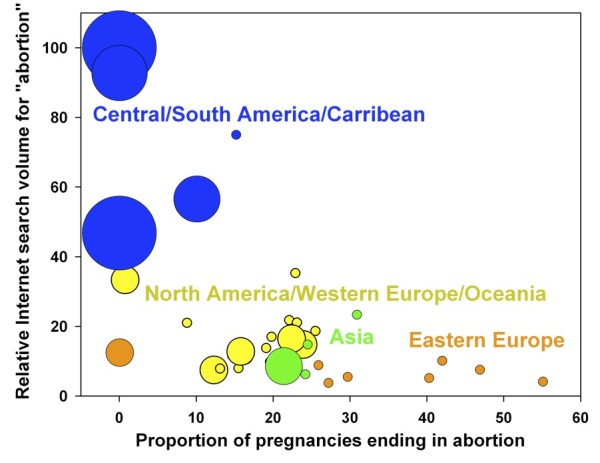
Figure 3.

Relationship between abortion search volume and abortion rates across 37 countries. Data from 37 countries also reveals an inverse correlation between abortion search volume and local abortion rates (Rho = -0.484, p = 0.004), with certain geographic regions showing general trends. Marker size indicates the number of restrictions (from 0 to 7) that exist on abortion in each country according to UNStats (See SOM).
