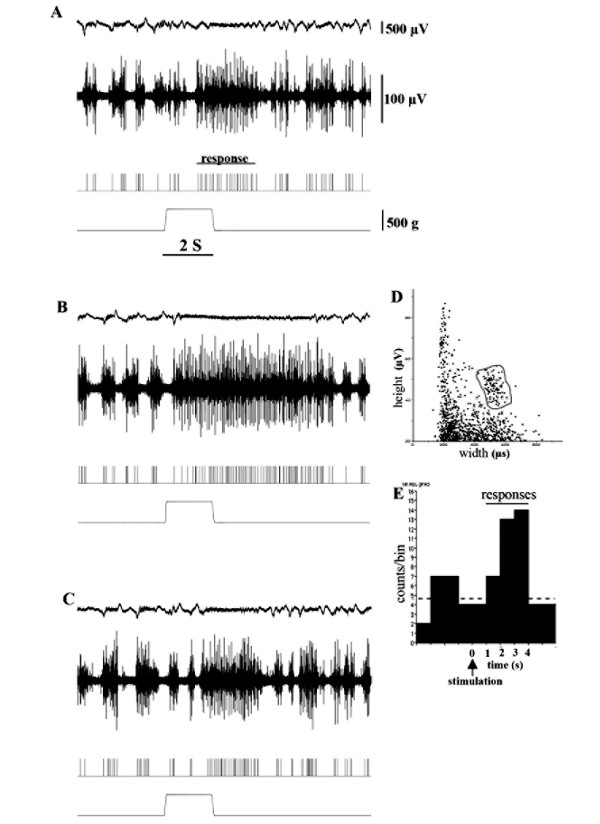
Figure 2.
Effects of CA1/SB inputs on nociceptive responses recorded in the PFC. A: Nociceptive responses evoked by mechanical stimulation. The top trace represents an electrocorticogram (ECo). The second trace is multiple unit discharges evoked by mechanical stimulation (500 g pressure bottom trace). The third trace represents single unit responses selected by cluster analysis from multi-units in the second line. The bottom trace represents a pressure curve. B: 30 min after HFS delivery to the subiculum areas of the HP, the discharge durations of nociceptive neurons were increased. C: 90 min after HFS nociceptive responses had recovered to the pre-control level. D: Discriminator view obtained using Spike Histogram software. Spikes were selected with the gray line representing single responses. E: Spike histogram composed of the spikes selected above. One bin is 1 s.

