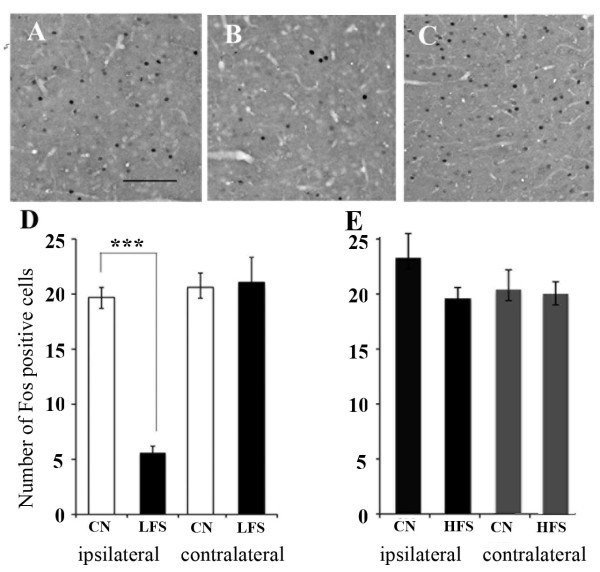
Figure 5.
Fos staining in prelimbic areas of the PFC. A: An untreated control showed Fos positive cells in the prelimbic area. B: LFS significantly decreased Fos expression in the ipsilateral prelimbic area. C: An untreated control showed Fos positive cells in the cingulate area. Scale lines represent 50 μm. D: Numbers of Fos-expressing cells in the ipsilateral and contralateral prelimbic areas before and after LFS. Fos positive cells were decreased in the prelimbic area. CN: control, LFS: low frequency stimulation *** P < 0.001. E: Numbers of Fos-expressing cells in the ipsilateral and contralateral cingulate areas before and after HFS.

