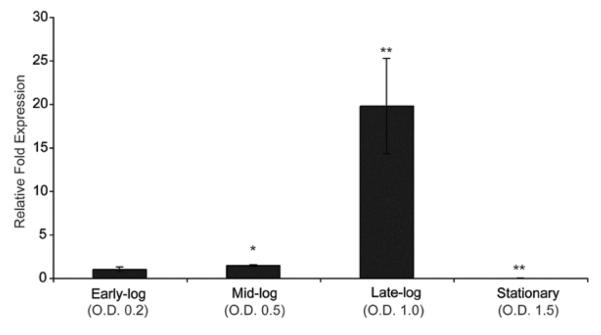
Figure 2.
Transcriptional profile of qseA gene expression for WT EHEC grown to early-, mid-, late-exponential, and stationary growth phases as measured by qPCR and expressed as fold differences normalized to WT strain 86-24 at early-exponential growth phase. The error bars indicate the standard deviations of the ΔΔCT values (Anonymous, 1997). Significance is indicated as follows: one asterisk, P ≤ 0.05; two asterisks, P ≤ 0.005; and three asterisks, P ≤ 0.0005. The levels of rpoA transcript were used to normalize the CT values to account for variations in bacterial numbers.

